QPSK modulation is a widely used digital modulation technique. It is a bandwidth efficient scheme because it allows to transmit two bits per symbol. Bandwidth efficient means that more information bits can be transmitted for a given allocated bandwidth. In this article the QPSK modulation is explained with the help of Matlab.
The mathematical form of QPSK signal is-
\[s(t)=\begin{cases}Acos(2\pi f_ct-\frac{3\pi}{4}) & dibit\space 00\\Acos(2\pi f_ct-\frac{\pi}{4}) & dibit\space10\\Acos(2\pi f_ct+\frac{\pi}{4}) & dibit\space01\\Acos(2\pi f_ct+\frac{3\pi}{4}) & dibit\space 11 \end{cases}\]
where, \[0\leq t\leq T\] and T is the symbol duration
The QPSK signal can also be written in the following compact form-
\[s(t)=Acos(2\pi f_ct+\phi (t)) \]
where,
\[\phi(t)=\begin{cases}-\frac{3\pi}{4} & dibit\space00\\-\frac{\pi}{4} & dibit\space10\\+\frac{\pi}{4} & dibit\space01\\+\frac{3\pi}{4} & dibit\space11 \end{cases}\]
The matlab code to generate these four QPSK signal is below-
% Generation of QPSK signal
clear
echo on
Ac=1 %Carrier Amplitude
fs=100; %Sampling frequency
fc=6; % carrier frequency
t=0:1/fs:5;
s00=Ac*cos(2*pi*fc*t-(3*pi/4)); %QPSK for dibit 00
s10=Ac*cos(2*pi*fc*t-(pi/4)); %QPSK for dibit 10
s11=Ac*cos(2*pi*fc*t+(3*pi/4)); %QPSK for dibit 11
s01=Ac*cos(2*pi*fc*t+(pi/4)); %QPSK for dibit 01
% plotting commands follow
subplot(4,1,1);
plot(t,s00);
title('s(t) for dibit 00')
subplot(4,1,2);
plot(t,s10);
title('s(t) for dibit 10')
subplot(4,1,3);
plot(t,s11);
title('s(t) for dibit 11')
subplot(4,1,4);
plot(t,s01)
title('s(t) for dibit 01')
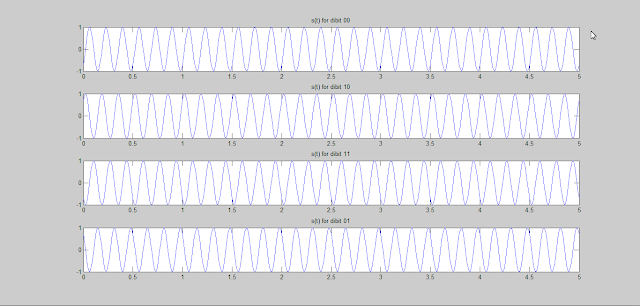
The QPSK signal graph is shown below-
See more on Matlab Tutorials
The mathematical form of QPSK signal is-
\[s(t)=\begin{cases}Acos(2\pi f_ct-\frac{3\pi}{4}) & dibit\space 00\\Acos(2\pi f_ct-\frac{\pi}{4}) & dibit\space10\\Acos(2\pi f_ct+\frac{\pi}{4}) & dibit\space01\\Acos(2\pi f_ct+\frac{3\pi}{4}) & dibit\space 11 \end{cases}\]
where, \[0\leq t\leq T\] and T is the symbol duration
The QPSK signal can also be written in the following compact form-
\[s(t)=Acos(2\pi f_ct+\phi (t)) \]
where,
\[\phi(t)=\begin{cases}-\frac{3\pi}{4} & dibit\space00\\-\frac{\pi}{4} & dibit\space10\\+\frac{\pi}{4} & dibit\space01\\+\frac{3\pi}{4} & dibit\space11 \end{cases}\]
The matlab code to generate these four QPSK signal is below-
% Generation of QPSK signal
clear
echo on
Ac=1 %Carrier Amplitude
fs=100; %Sampling frequency
fc=6; % carrier frequency
t=0:1/fs:5;
s00=Ac*cos(2*pi*fc*t-(3*pi/4)); %QPSK for dibit 00
s10=Ac*cos(2*pi*fc*t-(pi/4)); %QPSK for dibit 10
s11=Ac*cos(2*pi*fc*t+(3*pi/4)); %QPSK for dibit 11
s01=Ac*cos(2*pi*fc*t+(pi/4)); %QPSK for dibit 01
% plotting commands follow
subplot(4,1,1);
plot(t,s00);
title('s(t) for dibit 00')
subplot(4,1,2);
plot(t,s10);
title('s(t) for dibit 10')
subplot(4,1,3);
plot(t,s11);
title('s(t) for dibit 11')
subplot(4,1,4);
plot(t,s01)
title('s(t) for dibit 01')
The QPSK signal graph is shown below-
 |
| QPSK signal waveform |
Tidak ada komentar:
Posting Komentar