The Energy Spectral Density(ESD) and Power Spectral Density(PSD) are two important parameters in communication theory. They characterize signals as a function of frequency and also provide a convenient mathematical form that makes calculation easier. They are frequently encountered in the mathematical formula of communication theory and a firm grip on these parameter is important.
Here we investigate these parameters and obtain them using Matlab without using DFT/FFT functions that are incorporated in Matlab software. Their basic formula is converted and constructed in Matlab. The constructed Matlab code also outputs the two Spectral Density graph.
ESD(Energy Spectral Density) gives information about distribution of energy of an energy signal per unit bandwidth as a function of frequency. The unit of ESD is Joules/Hz.
PSD(Power Spectral Density) of a power signal gives information about the distribution of power per unit bandwidth as a function of frequency. The unit of PSD is Watt/Hz.
Energy Spectral Density
The formula for ESD for a energy signal x(t) is given by,
\[\psi_x(f)=|X(f)|^{2}\]
where X(f) is the Fourier transform of x(t)
This quantity can be used to find out the energy of the signal.
\[E_x=\int_{-\infty}^{\infty}x^{2}(t)dt =\int_{-\infty}^{\infty} \psi_x(f)df=\int_{-\infty}^{\infty} |X(f)|^{2}df \]
If x(t) is a real signal then X(f) is an even function of frequency and we can rewrite above equation as-
\[E_x=2\int_{0}^{\infty} \psi_x(f)df\]
Example:
This example shows how to calculate Energy Spectral Density(ESD) of energy signal.
The energy signal which will be used here is-
\[x(t)=\begin{cases}Acos(2\pi ft) & -\frac{T}{2}\leq t \leq \frac{T}{2}\\0 & elsewhere\end{cases}\]
Let A=5, f=1, T=4 then the matlab code for energy spectral density is below-
%Energy Spectral Density Calculation
t=[-2:0.001:2];
x=5*cos(2*pi*1*t);
figure
plot(t,x);
axis([-5 5 -6 6]);
xlabel('Time(t)----->')
ylabel('Amplitude ---->')
title('x(t) signal waveform')
k=0;
for f=-5:.01:5;
k=k+1;
X(k)=trapz(t,x.*exp(-j*2*pi*f*t));
end
ESD=X.*X;
f=-5:.01:5;
figure
plot(f,ESD)
xlabel('Frequency(f) ----->')
ylabel('Energy Spectral Density(ESD) ---->')
title('Energy Spectral Density Graph')
ESD_dB=10*log10(ESD);
figure
plot(f,ESD_dB);
xlabel('Frequency(f) ----->')
ylabel('Energy Spectral Density(ESD)in dB ---->')
title('Energy Spectral Density Graph')
The signal x(t) graph is shown below-
And the Energy Spectral Density graph is shown below-
Energy Spectral Density in dB graph is shown below-
Power Spectral Density
The formula for PSD for a power signal x(t) is given by,
\[ S_x(f)=\lim_{T \rightarrow \infty}\frac{1}{2T}\int_{-\infty}^{\infty} |X(f)|^{2}df \]
where X(f) is the Fourier Transform of x(t)
The power of a signal is then the integration of PSD,
\[P_x=\lim_{T \rightarrow \infty}\frac{1}{2T}\int_{-\infty}^{\infty}x^{2}(t)dt =\int_{-\infty}^{\infty} S_x(f)df=\int_{-\infty}^{\infty}\lim_{T \rightarrow \infty}\frac{1}{2T} |X(f)|^{2}df \]
Example
Let the power signal be-
\[x(t)=Acos(2\pi ft)\space\space\space\space\space\space\space\space\space\space\space\space\space\space\space\space\space\space\infty\leq t \leq \infty\]
This is a power signal because the signal is periodic and has infinite energy. Since this signal has infinite energy it may not be Fourier Transformable so we take a truncated version of this signal. This truncated signal is defined below-
\[ x_T(t)=\begin{cases}Acos(2\pi ft) & -\frac{T}{2}\leq t \leq \frac{T}{2}\\0 & otherwise\end{cases}\]
Now the signal is Fourier Transformable and therefore has corresponding frequency domain description and PSD can be obtained.
Let A=5, f=1 and T=4,
The matlab code to calculate Power Spectral Density is given below-
%Power Spectral Density Calculation
t=[-2:0.001:2];
x=5*cos(2*pi*1*t);
figure
plot(t,x);
axis([-5 5 -6 6]);
xlabel('Time(t)----->')
ylabel('Amplitude ---->')
title('x(t) signal waveform')
k=0;
for f=-5:.01:5;
k=k+1;
X(k)=trapz(t,x.*exp(-j*2*pi*f*t));
end
ESD=X.*X;
PSD=ESD./4;
f=-5:.01:5;
figure
plot(f,PSD)
xlabel('Frequency(f) ----->')
ylabel('Power Spectral Density(PSD) ---->')
title('Power Spectral Density Graph')
PSD_dB=10*log10(PSD);
figure
plot(f,PSD_dB);
xlabel('Frequency(f) ----->')
ylabel('Power Spectral Density(PSD) in dB---->')
title('Power Spectral Density Graph')
The truncated signal x(t) graph is shown below-
The Power Spectral Density graph is shown below-
The Power Spectral Density Graph in dB is shown below-
For more see Matlab tutorials and also see Matlab 2013 download blog post.
Here we investigate these parameters and obtain them using Matlab without using DFT/FFT functions that are incorporated in Matlab software. Their basic formula is converted and constructed in Matlab. The constructed Matlab code also outputs the two Spectral Density graph.
ESD(Energy Spectral Density) gives information about distribution of energy of an energy signal per unit bandwidth as a function of frequency. The unit of ESD is Joules/Hz.
PSD(Power Spectral Density) of a power signal gives information about the distribution of power per unit bandwidth as a function of frequency. The unit of PSD is Watt/Hz.
Energy Spectral Density
The formula for ESD for a energy signal x(t) is given by,
\[\psi_x(f)=|X(f)|^{2}\]
where X(f) is the Fourier transform of x(t)
This quantity can be used to find out the energy of the signal.
\[E_x=\int_{-\infty}^{\infty}x^{2}(t)dt =\int_{-\infty}^{\infty} \psi_x(f)df=\int_{-\infty}^{\infty} |X(f)|^{2}df \]
If x(t) is a real signal then X(f) is an even function of frequency and we can rewrite above equation as-
\[E_x=2\int_{0}^{\infty} \psi_x(f)df\]
Example:
This example shows how to calculate Energy Spectral Density(ESD) of energy signal.
The energy signal which will be used here is-
\[x(t)=\begin{cases}Acos(2\pi ft) & -\frac{T}{2}\leq t \leq \frac{T}{2}\\0 & elsewhere\end{cases}\]
Let A=5, f=1, T=4 then the matlab code for energy spectral density is below-
%Energy Spectral Density Calculation
t=[-2:0.001:2];
x=5*cos(2*pi*1*t);
figure
plot(t,x);
axis([-5 5 -6 6]);
xlabel('Time(t)----->')
ylabel('Amplitude ---->')
title('x(t) signal waveform')
k=0;
for f=-5:.01:5;
k=k+1;
X(k)=trapz(t,x.*exp(-j*2*pi*f*t));
end
ESD=X.*X;
f=-5:.01:5;
figure
plot(f,ESD)
xlabel('Frequency(f) ----->')
ylabel('Energy Spectral Density(ESD) ---->')
title('Energy Spectral Density Graph')
ESD_dB=10*log10(ESD);
figure
plot(f,ESD_dB);
xlabel('Frequency(f) ----->')
ylabel('Energy Spectral Density(ESD)in dB ---->')
title('Energy Spectral Density Graph')
The signal x(t) graph is shown below-
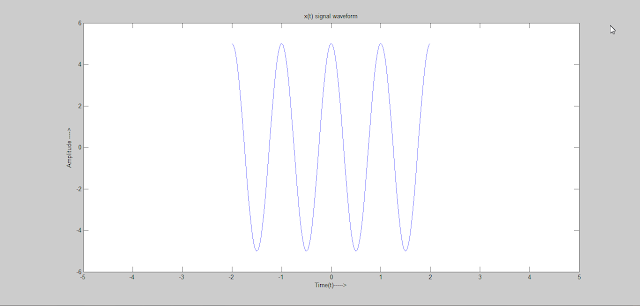 |
| Energy Signal x(t) |
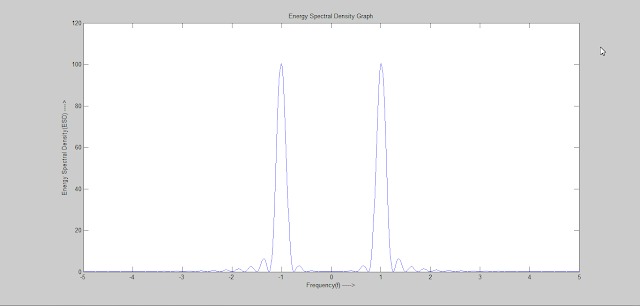 |
| Energy Spectral Density graph |
 |
| Energy Spectral Density in dB |
Power Spectral Density
The formula for PSD for a power signal x(t) is given by,
\[ S_x(f)=\lim_{T \rightarrow \infty}\frac{1}{2T}\int_{-\infty}^{\infty} |X(f)|^{2}df \]
where X(f) is the Fourier Transform of x(t)
The power of a signal is then the integration of PSD,
\[P_x=\lim_{T \rightarrow \infty}\frac{1}{2T}\int_{-\infty}^{\infty}x^{2}(t)dt =\int_{-\infty}^{\infty} S_x(f)df=\int_{-\infty}^{\infty}\lim_{T \rightarrow \infty}\frac{1}{2T} |X(f)|^{2}df \]
Example
Let the power signal be-
\[x(t)=Acos(2\pi ft)\space\space\space\space\space\space\space\space\space\space\space\space\space\space\space\space\space\space\infty\leq t \leq \infty\]
This is a power signal because the signal is periodic and has infinite energy. Since this signal has infinite energy it may not be Fourier Transformable so we take a truncated version of this signal. This truncated signal is defined below-
\[ x_T(t)=\begin{cases}Acos(2\pi ft) & -\frac{T}{2}\leq t \leq \frac{T}{2}\\0 & otherwise\end{cases}\]
Now the signal is Fourier Transformable and therefore has corresponding frequency domain description and PSD can be obtained.
Let A=5, f=1 and T=4,
The matlab code to calculate Power Spectral Density is given below-
%Power Spectral Density Calculation
t=[-2:0.001:2];
x=5*cos(2*pi*1*t);
figure
plot(t,x);
axis([-5 5 -6 6]);
xlabel('Time(t)----->')
ylabel('Amplitude ---->')
title('x(t) signal waveform')
k=0;
for f=-5:.01:5;
k=k+1;
X(k)=trapz(t,x.*exp(-j*2*pi*f*t));
end
ESD=X.*X;
PSD=ESD./4;
f=-5:.01:5;
figure
plot(f,PSD)
xlabel('Frequency(f) ----->')
ylabel('Power Spectral Density(PSD) ---->')
title('Power Spectral Density Graph')
PSD_dB=10*log10(PSD);
figure
plot(f,PSD_dB);
xlabel('Frequency(f) ----->')
ylabel('Power Spectral Density(PSD) in dB---->')
title('Power Spectral Density Graph')
The truncated signal x(t) graph is shown below-
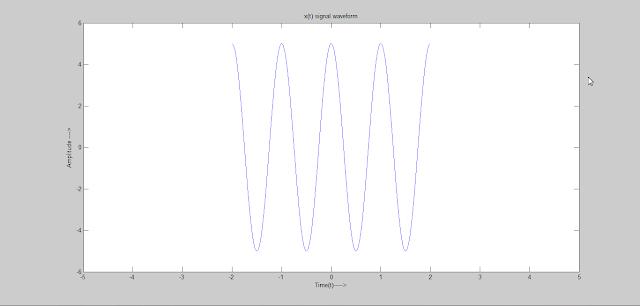 |
| Truncated Power Signal |
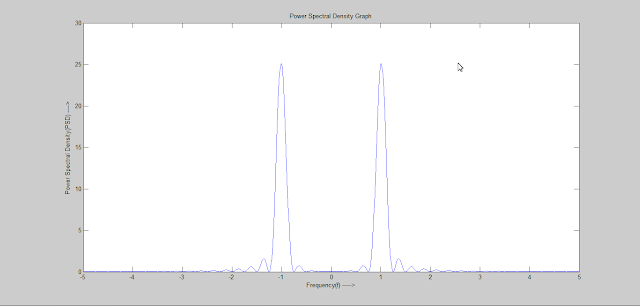 |
| Power Spectral Density Graph |
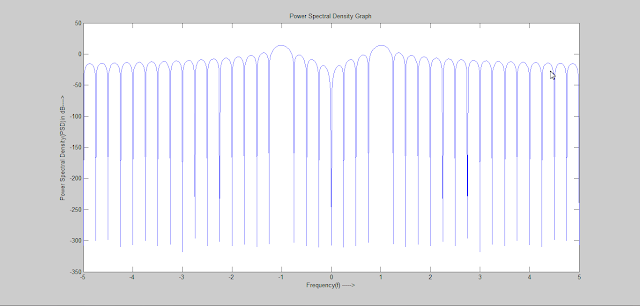 |
| Power Spectral Density in dB |
Tidak ada komentar:
Posting Komentar