This tutorial is about Power Spectral Density(PSD) of NRZ and RZ On-Off signals using Matlab. We start with definition and derivation of PSD for each and then generate the matlab code to plot the spectral densities. In the next tutorial we will plot PSD of Polar signals.
Readers interested in circuit simulation in orcad capture of such baseband encoding can visit the following tutorials here on this blog-
In the communication system design and engineering, Power spectral density is an important parameter as it gives us the information about the Power contained by a signal. This in turn gives us indication about SNR and thereof the distance between the transmitter and the receiver among many other things.Readers interested in circuit simulation in orcad capture of such baseband encoding can visit the following tutorials here on this blog-
Suppose x(t) is an input signal that goes into a pulse shaping filter with response p(t) and the output of the pulse shaping filter is y(t). Let their respective Fourier Transform be X(w), P(w) and Y(w)respectively and their the PSD of x(t) and PSD of y(t) be Sx(w) and Sy(w). This concept is shown below-
Then the relation between input and output PSD is- \[S_y(w)=|P(w)|^{2}S_x(w)\space\space\space\space\space\space---->(1)\]
Hence to find out the PSD of the output signal y(t) we require two things- the PSD of the input signal x(t) and the F.T. P(w) of the pulse p(t).
For each NRZ and RZ On-Off signal both Sx(w) and P(w) will be different. We show the values of these parameters starting with NRZ and then for RZ.
NRZ On-Off Signalling
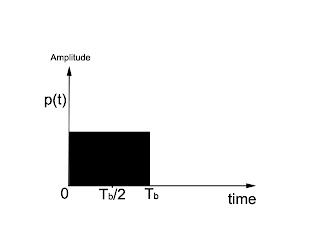
In case of NRZ, binary one is transmitted using a +ve pulse p(t) for full bit duration Tb and binary zero is transmitted by transmitting nothing. The diagram for NRZ On-Off signal is shown is shown below-
 |
| Figure: NRZ On Off Signal |
\[p(t)=rect(t/T)=\begin{cases}1 & -T_b/2< t < T_b/2\\0 & \space\space\space\space\space\space\space\space\space\space\space|t|>1/2\end{cases}\]
The FT of this signal is
\[P(w)=\int_{0}^{T_b} p(t)*e^{-jwt} dt=\int_{-T_b/2}^{T_b/2} p(t)*e^{-jwt} dt=\int_{-T_b/2}^{T_b/2} e^{-jwt} dt\]
This evaluates to,
\[P(w)=T_b*sinc(\frac{w*T_b}{2})\space\space\space\space\space\space\space\space\space\space\space\space------>(2)\]
The derivation of PSD of x(t) is lengthy so we directly show it here. The PSD of x(t) is given by-
\[S_x(w)=\frac{1}{4*T_b}+\frac{2\pi}{4*T_b^{2}}\sum_{n=-\infty}^\infty\delta(w-\frac{2\pi n}{T_b})\space\space\space\space\space\space---->(3)\]
From equation (1) using equation (2) and (3), the PSD of output signal y(t) evaluates to-
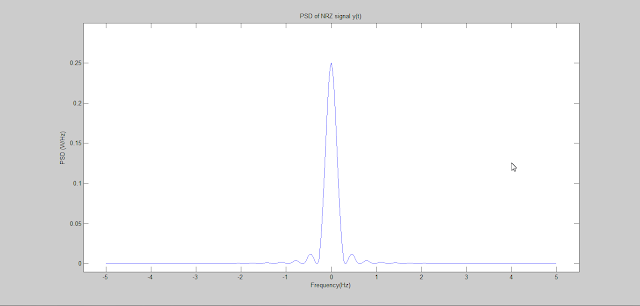
\[S_y(w)=\frac{T_b}{4}*sinc^{2}(\frac{w*T_b}{2})+\frac{\pi}{2}\delta(w) \space\space\space\space\space\space---->(4)\]
The matlab code to generate this PSD is provided below-
% PSD of On-Off NRZ signal
clear on
clc
Tb=1;
Rb=1/Tb;
faxis=-5*Rb:Rb/100:5*Rb;
w=2*pi*faxis;
Sy=(Tb/4)*(sinc((w*Tb)/2)).^2
plot(faxis,Sy)
xlabel('Frequency(Hz)')
ylabel('PSD (W/Hz)')
title('PSD of NRZ signal y(t)')
axis([-5.5 5.5 -0.01 0.3])
The Power spectral density of NRZ On-Off signal is shown below-
 |
| Figure: Power spectral density of NRZ On-Off signalling |
RZ On-Off Signalling
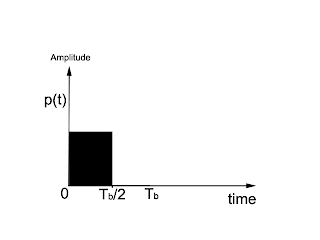
A rectangular RZ On-Off signal is shown below-
 |
| Figure: RZ On Off Signal |
This rectangular signal is defined as-
\[p(t)=rect(2t/T)=\begin{cases}1 & -T_b/4< t < T_b/4\\0 & \space\space\space\space\space\space\space\space\space\space\space|t|>1/4\end{cases}\]
The FT of this signal is
\[P(w)=\int_{0}^{T_b/2} p(t)*e^{-jwt} dt=\int_{-T_b/4}^{T_b/4} p(t)*e^{-jwt} dt=\int_{-T_b/4}^{T_b/4} e^{-jwt} dt\]
This evaluates to,
\[P(w)=\frac{T_b}{2}*sinc(\frac{w*T_b}{4})\space\space\space\space\space\space\space\space\space\space\space\space------>(5)\]
Again PSD of x(t) will not be derived here. The PSD of x(t) is given by-
\[S_x(w)=\frac{1}{4*T_b}+\frac{2\pi}{4*T_b^{2}}\sum_{n=-\infty}^\infty\delta(w-\frac{2\pi n}{T_b})\space\space\space\space\space\space---->(6)\]
Substituting equation (5) and (6) into equation (1) yields the PSD of output signal y(t) as-
\[S_y(w)=\frac{T_b^{2}}{16}*sinc^{2}(\frac{w*T_b}{4})[1+\frac{2 \pi}{T_b}\sum_{n=-\infty}^\infty\delta(w-\frac{2 \pi}{T_b})] \space\space\space\space\space\space---->(7)\]
The matlab code to generate this PSD is provided below-
% PSD of ON-OFF RZ signal
Tb=1;
Rb=1/Tb;
faxis=-5*Rb:Rb/100:5*Rb;
w=2*pi*faxis;
Sy=(Tb^2/16)*sinc((w*Tb)/4).^2;
plot(faxis,Sy)
xlabel('Frequency(Hz)')
ylabel('PSD (W/Hz)')
title('PSD of RZ signal y(t)')
axis([-5.5 5.5 -0.01 0.3])
The PSD of RZ On-Off signal is shown below-
 |
| Figure: Power Spectral Density of RZ On-Off signal |
See more Matlab tutorials

Tidak ada komentar:
Posting Komentar