Senin, 30 Januari 2012

Bode plot of an Amplifier | Altium Designer Tutorial

In last altium designer tutorial it was shown how to design an amplifer and how to bias the transistor using voltage divider biasing technique.

In this tutorial a Bode plot graph in altium designer software for the previously designed CE amplifier is illustrated. Bode plot basically gives the frequency response of the transfer function or gain of the amplifier. Frequency response means how the magnitude and phase of the voltage gain varies with frequency. Overall, when a signal passes through an amplifier, the signal is amplified and phase shifted and this information is given by the magnitude bode plot and the phase bode plot.

Draw the schematic as shown below-
CE Amplifier
Fig: CE Amplifier

Now to get the frequency response of the voltage gain Av=Vout/Vin we first have to set up the simulation analysis. To do this either click on the Setup Mixed Signal Simulation icon on the toolbar or goto Design> Stimulate> Mixed Sim. Doing this will bring up the setup menu where you can select the desired simulation required. In our case we want to Bode plot which requires selecting the AC Small Signal Analysis. Select this as shown in figure below-

Simulation Setting for Bode plot
Fig: Simulation Setting for Bode plot

In the AC analysis tab, select frequency range from 1Hz to 1THz(it's high but its required to get the magnitude plot for our design) and select Decade as the Sweep type as shown in figure below-

Simulation Setting for Bode plot
Fig: Simulation Setting for Bode plot

 Once this is done run the simulation by clicking on the Run Mixed Signal Simulation button in the toolbar.

Because we have not yet specified which signal to trace altium designer shows some signal, here in this case it is showing the netc1_1 signal as shown-
Editing Signal
Fig: Editing Signal

Right click (or double click) on the signal and select edit wave.Then in the edit waveform window enter vout/vin and select magnitude(db) from the complex function option. Give some meaning full name to the signal such as voltage gain and click on create as shown below-
Magnitude Bode plot
Fig: Magnitude Bode plot
The voltage gain magnitude in db is shown below-
Magnitude Response of Amplifier
Fig: Magnitude Response of Amplifier
We need to figure out the lower and higher cutoff frequencies where the magnitude fall down to 3dB(-3dB) from the mid value of the magnitude. We can do this using marker. To use marker in altium designer waveform window, right click on the signal voltage gain and then select Cursor A as shown below-
editing -3dB magnitude response
Fig: editing -3dB magnitude response

Drag the cursor a to somewhere in the middle of the top of the waveform where it has maximum value. This is illustrated below-
editing -3dB magnitude response
Fig: editing -3dB magnitude response
With respect to this point we will find another point where it decreases by -3dB. For this we require another marker, so as before, right click on the signal voltage gain and select Cursor B. To view the location of the -3dB point, drag the cursor b such that the difference B-A under the measurement in Sim Data window shows -3. Sim Data is docked usually at the right bottom of the screen. To get exact value you can zoom in by dragging a square into the point of place where you want to zoom in. This process is illustrated below-
editing -3dB magnitude response
Fig: editing -3dB magnitude response
According to this amplifier design the lower -3dB cutoff frequency is located at a frequency of 417.12 KHz.

-3dB location
Fig: -3dB location
Similarly by dragging the same b cursor we can get the higher cutoff frequency as 247.63 MHz.
upper cutoff frequency -3dB location
Fig: upper cutoff frequency -3dB location
To get the phase Bode plot, right click on the graph and select add plot. A wizard pops up. Give a suitable name such as phase plot. Click next until Add waveforms to the new plot is appears. Click Add and enter the expression for the voltage gain(vout/vin), give suitable name such as phase, and also select the Phase(Deg) under the Complex Function option. And then click Create and then Next to finish up the wizard. This process is shown below-
Phase plot setting
Fig: Phase plot setting
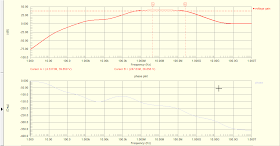
The new phase plot window appears as shown-
Bode plots
Fig: Bode Plots
Thus this two graph shows the frequency response or Bode plot of the amplifier which was designed in the previous blog post.

Selasa, 24 Januari 2012

Amplifier design | Orcad Capture Tutorial

In the last altium designer tutorial we designed an CE amplifier that amplified a 10mV signal. In that tutorial we used voltage divider biasing technique in order to set the operating point for the amplifier. Here we will use the same schematic in orcad capture to verify its operation and the output input signal waveform in orcad capture. This will help us compare altium designer and orcad capture simulation result. Let's see if there is any differences.

Below is the recreated schematic in orcad capture.

CE amplifier design schematic
Fig: CE amplifier design schematic
The voltage probe has been added at the input and output. The simulation settings are as shown below-
Simulation setup
Fig: Simulation setup

After running the simulation we get the following signal waveform-
Simulation Result
Fig: Simulation Result
The green waveform is the input signal and the red is the output signal waveform. As you can see the output signal is amplified and inverted in respect to the input waveform.

Let separate the signal waveform window. We can add net label to the wire where we want to collect the waveform data as in altium designer. The picture below shows Vin and Vout added to the schematic.
adding net label in orcad capture
Fig: adding net label in orcad capture
In altium designer seperate waveform graph were shown. In orcad capture, we can do that by first going to Trace> Add Trace option in the toolbar and then select the Vout from the signal list. This is similar to the process in Altium Designer-
adding trace in orcad capture
Fig: adding trace in orcad capture
The Vout waveform graph will be shown. Now we want to add another graph for Vin, for which you need to go to Plot> Add Plot to Window and a new plot window will appear as shown below-
adding plot window in orcad capture
Fig: adding plot window in orcad capture
Of course the new plot window is empty because we have not added any signal. To add Vin signal, again as before go to Trace> Add Trace and select the Vin signal and the signal should appear as shown below-
adding signal to new plot window
Fig: adding signal to new plot window
At first it looks like the Vin has greated amplitude than Vout but this is only because of the y-axis settings. We need to change the y-axis setting to -40mV and +40mV which can be done by right clicking on the upper Vin waveform graph and selecting the setting option. Then go to the Y-Axis tab and set the min and max as -40mV and +40mV. This is shown below-
changing y-axis setting
Fig: changing y-axis setting
The final waveform graph for the input and output waveform is shown below-
Input,output waveform of the amplifer
The waveform graph as obtained from Altium designer simulation is also shown below for comparison-
Input,output waveform of the amplifer in altium designer
Fig: Input,output waveform of the amplifer in altium designer
The simulation waveforms are same and there is not much change in the values of amplitude or phase.

Readers can go through the earlier post on designing amplifier where it was shown how the values of the resistors were calculated for the voltage divider biasing.

Amplifier Design & Simulation | Altium Designer Tutorial

This complete step by step tutorial demonstrates how to design CE amplifier with voltage divider biasing method and simulate the design in Altium Designer. The transistor used is the 2N3904 general purpose transistor.

Suppose we have a signal with amplitude of 10mV(close to actual typical voltage from a microphone) and we want to amplify the signal to give an output signal with some higher voltage amplitude. We begin by assuming the collector current to be 10mA. We also start with a d.c supply of 9V from a battery for example. The first thing we need to do is to bias the transistor in it's linear active region as this is where the transistor will function as an amplifier.

We assume here that you know how to create a new project in altium designer and have a blank schematic open. Once you have the schematic open place the transistor(2N3904), the resistors and a d.c source and connect them as shown in the schematic figure below-
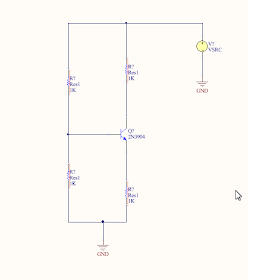
Voltage Divider Biasing
Fig: Voltage Divider Biasing
This is the skeleton of the voltage divider biasing. Now change the d.c voltage of the VSRC to 10V. To do this (as some might not know) double click on the VSRC and then click on edit and then select Parameters tab and enter +10V in the value box. This is shown below-
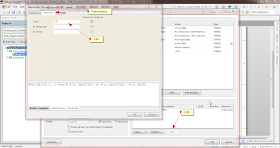
Setting up Power Supply
Fig: Setting up Power Supply
Click on OK to make the change. To make this value +9V visible on the schematics you have click on the check box and click on edit and again turn on the check box for visible option. This is shown below-
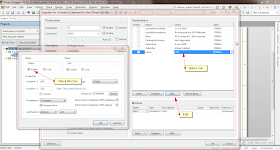
Setting up Power Supply
Fig: Setting up Power Supply
Also change the designator name to Vcc and after this the source VSRC should look like the one below-
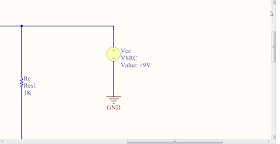
Power Supply
Fig: Power Supply
Let's also rename the resistors in the schematics so that the discussion remains intact.
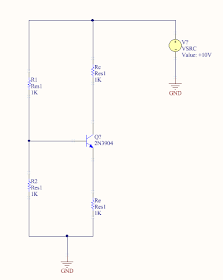
Renaming Resistors
Fig: Renaming Resistors
The proper names are now addressed in the above schematic. The resistors R1 and R2 forms the voltage divider resistors.

Now we are ready for the biasing part. At this point you may want to read the what is transistor baising? post which explains quite a bit what is biasing.

Let's start by making the emitter voltage drop of one tenth of the supply voltage-
\[V_E=\frac{V_{CC}}{10}=\frac{9V}{10}=0.9V\]

Know that the collector current and emitter current are approximately-
\[I_E \approx I_c =10mA\]
We can calculate now the resistor at the emitter-
\[R_E =\frac{V_E}{I_E}=\frac{0.9V}{10mA}=90ohm\]
From this we get the collector resistor value-
\[R_C =4R_E=4*90ohm=360ohm\]
 Now we use the below formula to calculate the resistor R1 value-
\[R_1<\frac{\beta_{dc}*R_E}{10}\]
which gives-
\[R_1<\frac{100*90ohm}{10}=900ohm\]

Now to calculate R2 we can use the voltage divider formula-
\[\frac{R_2}{R_1}=\frac{V_2}{V_1}\]
or,
\[R_2=R_1\frac{V_2}{V_1}\]
We have,
\[V_2=V_E+V_{BE}=0.9V+0.7V=1.6V\]
and,
\[V_1=V_{CC}-V_2=9V-1.6V=7.4V\]
Thus using these values we get,
\[R_2=R_1\frac{V_2}{V_1}=900ohm\frac{1.6V}{7.4V}=194.59ohm\approx195ohm\]

The following figure shows the schematics after entering the resistor values-
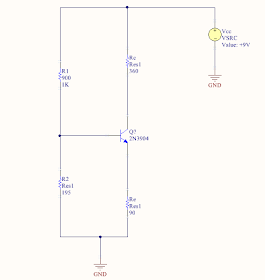
Resistor Values
Fig: Resistor Values
Now we add a signal source and a load resistor at the input and output of the circuit.

Adding signal source and load
Fig: Adding signal source and load
Double click the VSIN source to edit its properties. Click on edit and then parameters to set the amplitude to 10mV and frequency to 1kHz as shown in figure-
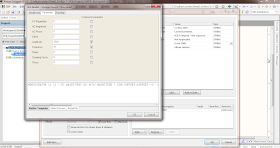
Setting up Input Signal
Fig: Setting up Input Signal
Similarly change the load resistor value to 10kohm.
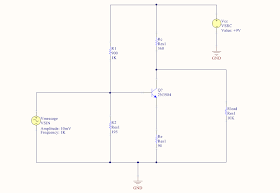
Setting up Load
Fig:Setting up Load
Now we need to add a coupling capacitor between the signal source and the amplifier and another coupling capacitor between the amplifier and the load resistor. Now what is the purpose of the coupling capacitor? Coupling capacitors are capacitors that couples ac signal from the source to the amplifier and blocks dc signal to cross over it. Similarly at the output it allows the ac signal to pass through it and blocks the dc signal. The coupling capacitor also functions to maintain the bias of the amplifier.
Now is the picture where two coupling capacitors at the input and output of the amplifier are added-
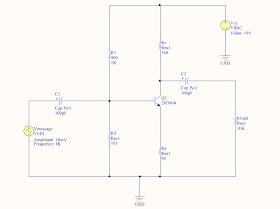
Adding Coupling Capacitors
Fig: Adding Coupling Capacitors
The name of the capacitors have been changed to C1 and C2. C1 is the coupling capacitor at the input and the C2 the coupling capacitor at the output.
How to determine the value of the coupling capacitors? Here is a formula to calculate the capacitance of the coupling capacitors-
\[X_c<\frac{Z}{10}\]
where, Xc is the reactance of the capacitor and Z is the load impedance

We first calculate the value of coupling capacitor capacitance C2 at the output because it will make easier to understand.
\[X_{c2}<\frac{Z}{10}=\frac{R_{load}}{10}=\frac{10kohm}{10}=1kohm\]
Therefore,
\[\frac{1}{2\pi f C_2}<1kohm\]
or
\[C_2>\frac{1}{2\pi f*1k}=\frac{1}{2\pi 1k*1k}=0.159\mu F\]
at f=1kHz
That is at this value C2 is short circuit for a.c signal of 1kHz. But we will take an approximate value of C2 greater than that calculated above as C2= 0.8 uF(assuming 20Hz frequency). This capacitor of 0.8uF can pass any signal above 20Hz including our 1KHz but will block the d.c signal.

Similarly we can just take C1=0.8uF. But if one wishes one can calculate the total impedance after the C1 capacitor (until ground) and use the above formula to calculate capacitive reactance first and then the capacitance. The output impedance for the input coupling capacitor is parallel combination of R1, R2 and the Zin(base) of the transistor.

So taking 0.8uF as our coupling capacitor value we have the following schematic-
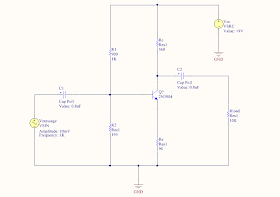
Adding Coupling Capacitors value
Fig: Adding Coupling Capacitors value
We also need a bypass capacitor at the parallel to the resistor at the emitter. But how to calculate bypass capacitor value? The value of the bypass capacitor can be determined using the same formula as for the coupling capacitor above. That is-
\[X_c<\frac{Z}{10}\]
The function of the bypass capacitor is to short the ac signal at certain range of frequency to the ground and that is why it is also known as a.c ground. This means here that the a.c signal at the emitter should be grounded at the frequency of interest(1kHz).
Taking f=1kHz, and Z=90ohm gives us decoupling capacitor C3 value of-
\[C_3>17.69\mu F\]
 But taking lower frequency into account say as before f=20Hz gives us-
\[C_3>0.088\mu F\]
taking approximate-
 \[C_3>0.1\mu F\]
This bypass capacitor with its value is shown in the schematic below-
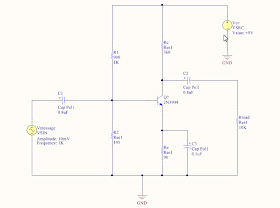
Complete Amplifer Design schematic
Fig: Complete Amplifer Design schematic
Circuit Simulation Using Altium Designer

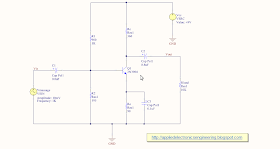
Before we start the simulation we need to attach labels to the wire(or Net) where we want to collect the signal waveform. In this tutorial we will get the waveform of the input signal and the output signal.

To attach a Net label right click on the schematic and choose Place> Net Label or click the Net icon on the toolbar. Add two net labels at the input and output and rename them as Vin and Vout as shown in the figure below-
Adding Net Labels
Fig: Adding Net Labels
Compile the project by going to the Project >> Compile PCB Project

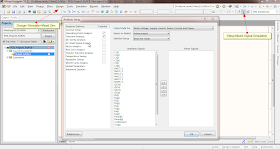
Once this is done, click on the Setup Mixed-Signal Simulation icon on the toolbar as shown in the figure below. If this is not visible you can bring it up and attach that icon to the toolbar by going to the Design>Stimulate>Mixed Sim. This is also shown below-
Simulation Setting in Altium Designer
Fig: Simulation Setting in Altium Designer
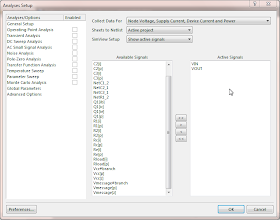
Now, in order to capture the input and output waveform ensure that the collect data option has voltage node, supply current, device current and power selected. Also set the simview setup option to show active signals.

From the available signal lists select the two signals Vin and Vout and click on the '>' to move them to the active signal list. This is shown below-
Simulation Setting in Altium Designer
Fig: Simulation Setting in Altium Designer
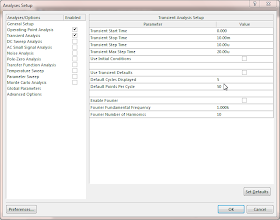
Select the operating point analysis and the transient analysis. To change the default transient settings, uncheck the Use Transient Default. Set the Transient Stop Time to 10m and Transient Step Time to 10u as shown below-
Simulation Setting in Altium Designer
Fig: Simulation Setting in Altium Designer
Now to run the simulation, click on the Run Mixed-Signal Simulation as shown-
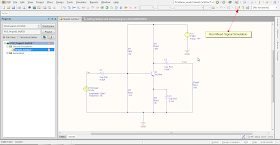
Running Simulation in Altium Designer
Fig: Running Simulation in Altium Designer
This will generate the desired input(Vin) and output signal(Vout) waveform as shown below-
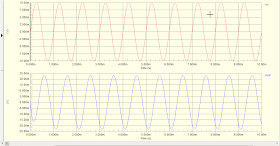
Resulting Input and Output Waveform
Fig: Resulting Input and Output Waveform
From the waveform we can see that the magnitude of the output waveform is approximately 23mV. Peak to peak voltage of input is ofcourse 20mV whereas the peak to peak voltage of output waveform is 46mV. Notice that the input and output waveform are also out of phase 180 degree. Thus the amplifier designed has produced an output signal that is amplified and inverted.

Practical RF circuit design | Les Besser Rowan Gilmore

les besser rowan gilmore RF circuit design practical ebook free
Practical RF Circuit Design for Modern Wireless System by L explains RF system design with examples showing radio of a typical RF System, the architecture, analysis of a CDMA handset. It also discusses the CAD/ CAE of linear RF/MW circuit- transient analysis, DC analysis, AC analysis, circuit synthesis, electromagnetic simulation and discusses recent popular electronics design softwares such as Agilent ADS, Ansoft designer, AWR Microwave Office and Eagleware Genesys. It also contains important components of RF system such as RF amplifier, RF mixers, RF filters, resonators and oscillators, s-parameter and impedance matching to name few.
Download Link:

http://www.filefactory.com/file/3u4736nuj9r5/n/Les_Besser_Rowan_Gilmore_Practical_RF_Circuit_Design_for_Modern_Wireless_Systems_Passive_Circuits_and_Systems_Volume_I_2003.pdf

Other related Free RF eBooks:

Senin, 23 Januari 2012

COLOUR TV SERVICE CODE

YOU CAN SEE HERE MANY TV COMPANY SUCH LIKE "TCL, ONIDA, SANSUI, HUNDAI, AKAI, SONY, LG" AND MANY MORE

Minggu, 22 Januari 2012

CST Studio Suite 2012 download for free

CST Studio Suite is a EM simulation software used for design simulation and visualization of electronics system such as Microwave Antenna simulation using CST Microwave Studio for mobile handset, free moving particles simulation using CST Particle Studio which is useful for quantum communication system design, cable and transmission line simulation, CST PCB Studio for printed board circuit simulation, thermal simulation, 3D visualization etc.

CST Microwave Studio is part of CST studio and essentially an antenna modelling software. Electronic engineers are usually interested in CST Microwave Studio because it helps the antenna designer to prototype and visualize the EM pattern direction around the modeled antenna and thus visualize its radiated distance and effect to the surrounding area. CST microwave studio cannot be separately downloaded and comes in package with CST Studio Suite.You can download CST microwave studio with the cst studio suite package.

CST PCB Studio is another application useful to electronic engineers. It helps the pcb designers to visualize and see the electromagnetic wave imprints and impact on PCB board and thus providing them the means to optimize the pcb board for better performance. Download CST PCB studio from the cst studio suite package.

A screenshot for using CST Microwave Studio for antenna modelling is shown below:

CST Studio Suite 2012 download for free
An example of PCB design simulation using CST PCB Studio is shown below:

CST Studio Suite 2012 download for free

Links not working anymore

Sabtu, 21 Januari 2012

Maplesoft Maple FREE DOWNLOAD

Download Maplesoft Maple free from the links provided below. Maplesoft maple is a computer aided simulation software that can be used in various engineering sectors such as plant modelling with control design, virtual prototyping of equipments, aerospace, power control and others. Electronics designer can use it for creating 3D model and prototype of electronics products.

Links not working anymore

Why transistor biasing is required?

Transistors is the main electronic component in any electronic system. It is used in analog and digital circuitry and it can be used as an amplifier and/ or a switch. When starting any circuit design that involves transistor is finding out what the function of the transistor is and what is supposed to do and deliver in the circuit. It may be either used as an amplifier or as a switch. When it is used as an amplifier it operates in the active region and if it is used for switch application then it operates in the saturation and cutoff region, that is, it switches between these two region.

So depending upon the transistor function requirement the transistor is based to operate in those aforementioned region. For amplification function, the transistor is designed to operate in the active region by proper biasing of the transistor.

Biasing is the process of adding external resistors in accordance to the applied voltage source supply so that the transistor operates in active region if it is used as an amplifier or in the cutoff/ saturation region if it is used as a switch. When it operates in the active region the B-E junction is forward biased and the C-B junction is revered biased. So biasing is also referred as process of making the B-E junction forward biased and C-B junction a reversed biased junction.

There are couple of different ways to bias a transistor. For example the addition of base resistor is one way, the addition of emitter resistance is another. Other popular biasing techniques are voltage divider biasing and self biasing. An example circuit of calculating biasing an amplifier is shown below-
Which biasing technique to choose? This question is answered by performance comparison and application. The biasing technique which produces output current and voltage invariant of change of temperature, transistor parameter such as current gain should be chosen. For example the fixed base biasing technique is not well suited for biasing because the output current(collector current) tend to vary with current gain. The emitter resistance biasing in comparison produces constant collector current and is less independent of the variation of current gain of the transistor.

Jumat, 20 Januari 2012

Mathworks Matlab: R2012a v7.14.0.739 Portable

 download Matlab 2012
Pic: download Matlab 2012
Download Matlab: R2012a portable for free. Matlab is the most popular simulation and design software used by engineers and engineering students.

Matlab 2012 is a programming, simulation and design software that can be used for variety of problems. Few examples are such as- to verify mathematical equation such as differential equations, see the output such as signal energy content, to model a any system such as communication system or control system with simulink. See the matlab simulink video tutorials on this blog.

Download Matlab 2012a to practice electronics design. For electronics engineers it provides many features such as creating a simulink model of communication system such as RF communication system, analog and digital design, designing transmitter and receiver, checking the power spectrum and waveforms, perform BER analysis, comparison of different modulation techniques. It also supports import and export of designed system to other electronics design software such as Xlinx FPGA via HDL codes generation. It also supports transistor level electronics circuit creation and simulation such as bipolar transistors and FET transisitors biasing, AC and DC analysis.

Removed complying to DMCA

Kamis, 19 Januari 2012

Audio Mixer Design, Simulation, Testing- Proteus Professional VMS software

This article demonstrates a simple audio mixer design, simulation and testing with real audio file in Proteus Professional.

The design schematics of the audio mixer is shown below-

audio mixer schematic, design, testing and simulation
Fig: audio mixer schematic, design, testing and simulation
In the circuit above two signals has been mixed one is a sinusoid signal and the another is a music audio file in .wav format. These generators are found in the generator palette. These signal are modulated and amplified with gain of 20 by the transistor BC109. The output is taken at the end of capacitor C2. To view all of the the signals an oscilloscope is used which is found in the instruments palette. The port A of the oscilloscope is connected to the sinusoidal signal generator, port B is connected to the audio generator and the port C is connected to the output.

The waveform as seen in the oscilloscope are shown below-

Sinusoid, Audio, Mixed Output Waveform in Oscilloscope
Fig: Sinusoid, Audio, Mixed Output Waveform in Oscilloscope

Sinusoid, Audio, Mixed Output Waveform in Oscilloscope
The yellow colored waveform is the sinusoid signal applied at port A, the blue colored waveform is the audio sound waveform at port B and the third pink colored waveform is the mixed signal at the output taken at port C as described above.

Note that the audio signal that was used here is an music file sampled at 8khz PCM and with mono format. To convert any music file to .wav format with above specification you can use software like Switch Sound File Converter. This software can convert any music file to any other music file extension.